- Home
- Careers
- Contact
- About
-
Who we are and what we do. -
Press releases, announcements, and notable corporate information. -
We are looking for a few A people. -
We have over 40 years of innovation to create value for our customers. -
We aim to be the highest value provider of every product and service we offer. -
An easy guide to Probe fundamentals.
-
- Services
-
In additional to the analytical results we normally include an expert analysts summary.
We use our decades of experience to help you better understand your data. -
CleanAir can insures that the project goals and testing are objectives are met.
-
We can ship what you need today. It will work. You get a company of experts when you rent from CleanAir. - Thermal Performance
-
- Rental
-
Our factory reconditioning experts work to make old as good as new. -
CleanAir can provide the services required to care of your emissions measurement or power measurement instruments, no matter the age, model or manufacturer.
-
We deliver rental, emergency, or supplemental instruments and onsite services quickly, with minimal operational interruptions .
-
- Products
Featured Product

UL Listed Mobile Temporary Power
Look professional. Don't risk a OSHA fine, or worse causing your customer to get an OSHA or MSHA fine by using an unsafe mobile power distribution system. The CleanAir Temporary Power cart is UL listed! Read more... -
Reference
-
Overviews of products and services -
Learn about our companies and business -
Detailed technical information about the functioning of our products -
Guides and instructions on proper installation and service -
Guides and instructions on proper installation and service -
Drawings, configuration, materials, and limits useful for the planning and layout.
-
CleanAir's reference of video content -
Publications addressing an issue or topic
-
- Site Map
 Express
 FTIR
FTIR Mercury
 Emission Sampling Equipment
 Instrument Rental
EPA Methods List with Links
DETERMINATION OF PM10 AND PM2.5 EMISSIONS FROM STATIONARY SOURCES (Constant Sampling Rate Procedure)
1.0 Scope and Applicability
1.1 Scope.
The U.S. Environmental Protection Agency (U.S. EPA or “we”) developed this method to describe the procedures that the stack tester (“you”) must follow to measure filterable particulate matter (PM) emissions equal to or less than a nominal aerodynamic diameter of 10 micrometers (PM10) and 2.5 micrometers (PM2.5). This method can be used to measure coarse particles (i.e., the difference between the measured PM10 concentration and the measured PM2.5 concentration).
1.2 Applicability.
This method addresses the equipment, preparation, and analysis necessary to measure filterable PM. You can use this method to measure filterable PM from stationary sources only. Filterable PM is collected in stack with this method (i.e., the method measures materials that are solid or liquid at stack conditions). If the gas filtration temperature exceeds 30°C (85°F), then you may use the procedures in this method to measure only filterable PM (material that does not pass through a filter or a cyclone/filter combination). If the gas filtration temperature exceeds 30°C (85°F), and you must measure both the filterable and condensable (material that condenses after passing through a filter) components of total primary (direct) PM emissions to the atmosphere, then you must combine the procedures in this method with the procedures in Method 202 of appendix M to this part for measuring condensable PM. However, if the gas filtration temperature never exceeds 30°C (85°F), then use of Method 202 of appendix M to this part is not required to measure total primary PM.
1.3 Responsibility.
You are responsible for obtaining the equipment and supplies you will need to use this method. You must also develop your own procedures for following this method and any additional procedures to ensure accurate sampling and analytical measurements.
1.4 Additional Methods.
To obtain results, you must have a thorough knowledge of the following test methods found in appendices A-1 through A-3 of 40 CFR part 60:
(a) Method 1 - Sample and velocity traverses for stationary sources.
(b) Method 2 - Determination of stack gas velocity and volumetric flow rate (Type S pitot tube).
(c) Method 3 - Gas analysis for the determination of dry molecular weight.
(d) Method 4 - Determination of moisture content in stack gases.
(e) Method 5 - Determination of particulate matter emissions from stationary sources.
1.5 Limitations.
You cannot use this method to measure emissions in which water droplets are present because the size separation of the water droplets may not be representative of the dry particle size released into the air. To measure filterable PM10 and PM2.5 in emissions where water droplets are known to exist, we recommend that you use Method 5 of appendix A-3 to part 60. Because of the temperature limit of the O-rings used in this sampling train, you must follow the procedures in Section 8.6.1 to test emissions from stack gas temperatures exceeding 205°C (400°F).
1.6 Conditions.
You can use this method to obtain particle sizing at 10 micrometers and or 2.5 micrometers if you sample within 80 and 120 percent of isokinetic flow. You can also use this method to obtain total filterable particulate if you sample within 90 to 110 percent of isokinetic flow, the number of sampling points is the same as required by Method 5 of appendix A-3 to part 60 or Method 17 of appendix A-6 to part 60, and the filter temperature is within an acceptable range for these methods. For Method 5, the acceptable range for the filter temperature is generally 120°C (248°F) unless a higher or lower temperature is specified. The acceptable range varies depending on the source, control technology and applicable rule or permit condition. To satisfy Method 5 criteria, you may need to remove the in-stack filter and use an out-of-stack filter and recover the PM in the probe between the PM2.5 particle sizer and the filter. In addition, to satisfy Method 5 and Method 17 criteria, youmay need to sample from more than 12 traverse points. Be aware that this method determines in-stack PM10 and PM2.5filterable emissions by sampling from a recommended maximum of 12 sample points, at a constant flow rate through the train (the constant flow is necessary to maintain the size cuts of the cyclones), and with a filter that is at the stack temperature. In contrast, Method 5 or Method 17 trains are operated isokinetically with varying flow rates through the train. Method 5 and Method 17 require sampling from as many as 24 sample points. Method 5 uses an out-ofstack filter that is maintained at a constant temperature of 120°C (248°F). Further, to use this method in place of Method 5 or Method 17, you must extend the sampling time so that you collect the minimum mass necessary for weighing each portion of this sampling train. Also, if you are using this method as an alternative to a test method specified in a regulatory requirement (e.g., a requirement to conduct a compliance or performance test), then you must receive approval from the authority that established the regulatory requirement before you conduct the test.
2.0 Summary of Method
2.1 Summary.
To measure PM10 and PM2.5, extract a sample of gas at a predetermined constant flow rate through an in-stack sizing device. The particle-sizing device separates particles with nominal aerodynamic diameters of 10 micrometers and 2.5 micrometers. To minimize variations in the isokinetic sampling conditions, you must establish well-defined limits. After a sample is obtained, remove uncombined water from the particulate, then use gravimetric analysis to determine the particulate mass for each size fraction. The original method, as promulgated in 1990, has been changed by adding a PM2.5 cyclone downstream of the PM10cyclone. Both cyclones were developed and evaluated as part of a conventional five-stage cascade cyclone train. The addition of a PM2.5 cyclone between the PM10 cyclone and the stack temperature filter in the sampling train supplements the measurement of PM10 with the measurement of PM2.5 Without the addition of the PM2.5 cyclone, the filterable particulate portion of the sampling train may be used to measure total and PM10 emissions. Likewise, with the exclusion of the PM10 cyclone, the filterable particulate portion of the sampling train may be used to measure total and PM2.5 emissions. Figure 1 of Section 17 presents the schematic of the sampling train configured with this change.
3.0 Definitions
3.1 Condensable particulate matter (CPM)
means material that is vapor phase at stack conditions, but condenses and/or reacts upon cooling and dilution in the ambient air to form solid or liquid PM immediately after discharge from the stack. Note that all CPM is assumed to be in the PM2.5 size fraction.
3.2 Constant weight
means a difference of no more than 0.5 mg or one percent of total weight less tare weight, whichever is greater, between two consecutive weighings, with no less than six hours of desiccation time between weighings.
3.3 Filterable particulate matter (PM),
means particles that are emitted directly by a source as a solid or liquid at stack or release conditions and captured on the filter of a stack test train.
3.4 Primary particulate matter (PM)
(also known as direct PM) means particles that enter the atmosphere as a direct emission from a stack or an open source. Primary PM has two components: filterable PM and condensable PM. These two PM components have no upper particle size limit.
3.5 Primary PM2.5
(also known as direct PM2.5, total PM2.5, PM2.5, or combined filterable PM2.5 and condensable PM) means PM with an aerodynamic diameter less than or equal to 2.5 micrometers. These solid particles are emitted directly from an air emissions source or activity, or are the gaseous or vaporous emissions from an air emissions source or activity that condense to form PM at ambient temperatures. Direct PM2.5emissions include elemental carbon, directly emitted organic carbon, directly emitted sulfate, directly emitted nitrate, and other inorganic particles (including but not limited to crustal material, metals, and sea salt).
3.6 Primary PM10
(also known as direct PM10, total PM10, PM10, or the combination of filterable PM10 and condensable PM) means PM with an aerodynamic diameter equal to or less than 10 micrometers.
4.0 Interferences
You cannot use this method to measure emissions where water droplets are present because the size separation of the water droplets may not be representative of the dry particle size released into the air. Stacks with entrained moisture droplets may have water droplets larger than the cut sizes for the cyclones. These water droplets normally contain particles and dissolved solids that become PM 10 and PM2.5 following evaporation of the water.
5.0 Safety
5.1 Disclaimer.
Because the performance of this method may require the use of hazardous materials, operations, and equipment, you should develop a health and safety plan to ensure the safety of your employees who are on site conducting the particulate emission test. Your plan should conform with all applicable Occupational Safety and Health Administration, Mine Safety and Health Administration, and Department of Transportation regulatory requirements. Because of the unique situations at some facilities and because some facilities may have more stringent requirements than is required by State or federal laws, you may have to develop procedures to conform to the plant health and safety requirements.
6.0 Equipment and Supplies.
Figure 2 of Section 17 shows details of the combined cyclone heads used in this method. The sampling train is the same as Method 17 of appendix A-6 to part 60 with the exception of the PM10 and PM2.5 sizing devices. The following sections describe the sampling train’s primary design features in detail.
6.1 Filterable Particulate Sampling Train Components.
6.1.1 Nozzle.
You must use stainless steel (316 or equivalent) or fluoropolymer-coated stainless steel nozzles with a sharp tapered leading edge. We recommend one of the 12 nozzles listed in Figure 3 of Section 17 because they meet design specifications when PM10 cyclones are used as part of the sampling train. We also recommend that you have a large number of nozzles in small diameter increments available to increase the likelihood of using a single nozzle for the entire traverse. We recommend one of the nozzles listed in Figure 4A or 4B of Section 17 because they meet design specifications when PM2.5 cyclones are used without PM10 cyclones as part of the sampling train.
6.1.2 PM10 and PM2.5 Sizing Device.
6.1.2.1. Use stainless steel (316 or equivalent) or fluoropolymer-coated PM10 and PM2.5 sizing devices. You may use sizing devices constructed of high-temperature specialty metals such as Inconel, Hastelloy, or Haynes 230. (See also Section 8.6.1.) The sizing devices must be cyclones that meet the design specifications shown in Figures 3, 4A, 4B, 5, and 6 of Section 17. Use a caliper to verify that the dimensions of the PM10 and PM2.5 sizing devices are within ±0.02 cm of the design specifications. Example suppliers of PM10 and PM2.5 sizing devices include the following:
(a) Environmental Supply Company, Inc., 2142 E. Geer Street, Durham, North Carolina 27704. Telephone No.: (919) 956-9688; Fax: (919) 682-0333.
(b) Apex Instruments, 204 Technology Park Lane, Fuquay-Varina, North Carolina 27526. Telephone No.: (919) 557-7300 (phone); Fax: (919) 557-7110.
6.1.2.2. You may use alternative particle sizing devices if they meet the requirements in Development and Laboratory Evaluation of a Five-Stage Cyclone System, EPA-600/7-78-008 (https://cfpub.epa.gov/ols).
6.1.3 Filter Holder.
Use a filter holder that is stainless steel (316 or equivalent). A heated glass filter holder may be substituted for the steel filter holder when filtration is performed out-of-stack. Commercial-size filter holders are available depending upon project requirements, including commercial stainless steel filter holders to support 25-, 47-, 63-, 76-, 90-, 101-, and 110-mm diameter filters. Commercial size filter holders contain a fluoropolymer O-ring, a stainless steel screen that supports the particulate filter, and a final fluoropolymer O-ring. Screw the assembly together and attach to the outlet of cyclone IV. The filter must not be compressed between the fluoropolymer O-ring and the filter housing.
6.1.4 Pitot Tube.
You must use a pitot tube made of heat resistant tubing. Attach the pitot tube to the probe with stainless steel fittings. Follow the specifications for the pitot tube and its orientation to the inlet nozzle given in Section 6.1.1.3 of Method 5 of appendix A-3 to part 60.
6.1.5 Probe Extension and Liner.
The probe extension must be glass- or fluoropolymer-lined. Follow the specifications in Section 6.1.1.2 of Method 5 of appendix A-3 to part 60. If the gas filtration temperature never exceeds 30°C (85°F), then the probe may be constructed of stainless steel without a probe liner and the extension is not recovered as part of the PM.
6.1.6 Differential Pressure Gauge, Condensers, Metering Systems, Barometer, and Gas Density Determination Equipment.
Follow the requirements in Sections 6.1.1.4 through 6.1.3 of Method 5 of appendix A-3 to part 60, as applicable.
6.2 Sample Recovery Equipment.
6.2.1 Filterable Particulate Recovery.
Use the following equipment to quantitatively determine the amount of filterable PM recovered from the sampling train.
(a) Cyclone and filter holder brushes.
(b) Wash bottles. Two wash bottles are recommended. Any container material is acceptable, but wash bottles used for sample and blank recovery must not contribute more than 0.1 mg of residual mass to the CPM measurements.
(c) Leak-proof sample containers. Containers used for sample and blank recovery must not contribute more than 0.05 mg of residual mass to the CPM measurements.
(d) Petri dishes. For filter samples; glass or polyethylene, unless otherwise specified by the Administrator.
(e) Graduated cylinders. To measure condensed water to within 1 ml or 0.5 g. Graduated cylinders must have subdivisions not greater than 2 ml.
(f) Plastic storage containers. Air-tight containers to store silica gel.
6.2.2 Analysis Equipment.
(a) Funnel. Glass or polyethylene, to aid in sample recovery.
(b) Rubber policeman. To aid in transfer of silica gel to container; not necessary if silica gel is weighed in the field.
(c) Analytical balance. Analytical balance capable of weighing at least 0.0001 g (0.1 mg).
(d) Balance. To determine the weight of the moisture in the sampling train components, use an analytical balance accurate to ± 0.5 g.
(e) Fluoropolymer beaker liners.
7.0 Reagents, Standards, and Sampling Media
7.1 Sample Collection.
To collect a sample, you will need a filter and silica gel. You must also have water and crushed ice. These items must meet the following specifications.
7.1.1 Filter.
Let Clean Air Help you with tared media!
We can provide you with tared filters and provide post-test analysis! Contact us today! Yes, we are NELAC accredited!
Use a nonreactive, nondisintegrating glass fiber, quartz, or polymer filter that does not a have an organic binder. The filter must also have an efficiency of at least 99.95 percent (less than 0.05 percent penetration) on 0.3 micrometer dioctyl phthalate particles. You may use test data from the supplier’s quality control program to document the PM filter efficiency.
7.1.2 Silica Gel.
Use an indicating-type silica gel of 6 to 16 mesh. You must obtain approval from the regulatory authority that established the requirement to use this test method to use other types of desiccants (equivalent or better) before you use them. Allow the silica gel to dry for two hours at 175°C (350°F) if it is being reused. You do not have to dry new silica gel if theindicator shows the silica is active for moisture collection.
7.1.3 Crushed Ice.
Obtain from the best readily available source.
7.1.4 Water.
Use deionized, ultra-filtered water that contains 1.0 part per million by weight (1 milligram/liter) residual mass or less to recover and extract samples.
7.2 Sample Recovery and Analytical Reagents.
You will need acetone and anhydrous calcium sulfate for the sample recovery and analysis. Unless otherwise indicated, all reagents must conform to the specifications established by the Committee on Analytical Reagents of the American Chemical Society. If such specifications are not available, then use the best available grade. Additional information on each of these items is in the following paragraphs.
7.2.1 Acetone.
Use acetone that is stored in a glass bottle. Do not use acetone from a metal container because it will likely produce a high residue in the laboratory and field reagent blanks. You must use acetone with blank values less than 1 part per million by weight residue. Analyze acetone blanks prior to field use to confirm low blank values. In no case shall a blank value of greater than 0.0001 percent (1 part per million by weight) of the weight of acetone used in sample recovery be subtracted from the sample weight (i.e., the maximum blank correction is 0.1 mg per 100 ml of acetone used to recover samples).
7.2.2 Particulate Sample Desiccant.
Use indicatingtype anhydrous calcium sulfate to desiccate samples prior to weighing.
8.0 Sample Collection, Preservation, Storage, and Transport
8.1 Qualifications.
This is a complex test method. To obtain reliable results, you should be trained and experienced with in-stack filtration systems (such as cyclones, impactors, and thimbles) and impinger and moisture train systems.
8.2 Preparations.
Follow the pretest preparation instructions in Section 8.1 of Method 5 of appendix A-3 to part 60.
8.3 Site Setup.
You must complete the following to properly set up for this test:
(a) Determine the sampling site location and traverse points.
(b) Calculate probe/cyclone blockage.
(c) Verify the absence of cyclonic flow.
(d) Complete a preliminary velocity profile and select a nozzle(s) and sampling rate.
8.3.1 Sampling Site Location and Traverse Point Determination.
Follow the standard procedures in Method 1 of appendix A-1 to part 60 to select the appropriate sampling site. Choose a location that maximizes the distance from upstream and downstream flow disturbances.
(a) Traverse points. The required maximum number of total traverse points at any location is 12, as shown in Figure 7 of Section 17. You must prevent the disturbance and capture of any solids accumulated on the inner wall surfaces by maintaining a 1-inch distance from the stack wall (0.5 inch for sampling locations less than 36.4 inches in diameter with the pitot tube and 32.4 inches without the pitot tube). During sampling, when the PM2.5 cyclone is used without the PM10, traverse points closest to the stack walls may not be reached because the inlet to a PM2.5cyclone is located approximately 2.75 inches from the end of the cyclone. For these cases, you may collect samples using the procedures in Section 11.3.2.2 of Method 1 of appendix A-3 to part 60. You must use the traverse point closest to the unreachable sampling points as replacement for the unreachable points. You must extend the sampling time at the replacement sampling point to include the duration of the unreachable traverse points.
(b) Round or rectangular duct or stack. If a duct or stack is round with two ports located 90o apart, use six sampling points on each diameter. Use a 3x4 sampling point layout for rectangular ducts or stacks. Consult with the Administrator to receive approval for other layouts before you use them.
(c) Sampling ports. You must determine if the sampling ports can accommodate the in-stack cyclones used in this method. You may need larger diameter sampling ports than those used by Method 5 of appendix A-3 to part 60 or Method 17 of appendix A-6 to part 60 for total filterable particulate sampling. When you use nozzles smaller than 0.16 inch in diameter and either a PM10 or a combined PM10 and PM2.5 sampling apparatus, the sampling port diameter may need to be six inches in diameter to accommodate the entire apparatus because the conventional 4-inchdiameter port may be too small due to the combined dimension of the PM10 cyclone and the nozzle extending from the cyclone, which will likely exceed the internal diameter of the port. A 4-inch port should be adequate for the single PM2.5 sampling apparatus. However, do not use the conventional 4-inch diameter port in any circumstances in which the combined dimension of the cyclone and the nozzle extending from the cyclone exceeds the internal diameter of the port. (Note: If the port nipple is short, you may be able to “hook” the sampling head through a smaller port into the duct or stack.)
8.3.2 Probe/Cyclone Blockage Calculations.
Follow the procedures in the next two sections, as appropriate.
8.3.2.1 Ducts with diameters greater than 36.4 inches. Based on commercially available cyclone assemblies for this procedure, ducts with diameters greater than 36.4 inches have blockage effects less than three percent, as illustrated in Figure 8 of Section 17. You must minimize the blockage effects of the combination of the in-stack nozzle/cyclones, pitot tube, and filter assembly that you use by keeping the cross-sectional area of the assembly at three percent or less of the cross-sectional area of the duct.
8.3.2.2 Ducts with diameters between 25.7 and 36.4 inches. Ducts with diameters between 25.7 and 36.4 inches have blockage effects ranging from three to six percent, as illustrated in Figure 8 of Section 17. Therefore, when you conduct tests on these small ducts, you must adjust the observed velocity pressures for the estimated blockage factor whenever the combined sampling apparatus blocks more than three percent of the stack or duct (see Sections 8.7.2.2 and 8.7.2.3 on the probe blockage factor and the final adjusted velocity pressure, respectively). (Note: Valid sampling with the combined PM2.5/PM10 cyclones cannot be performed with this method if the average stack blockage from the sampling assembly is greater than six percent, i.e., the stack diameter is less than 26.5 inches.)
8.3.3 Cyclonic Flow.
Do not use the combined cyclone sampling head at sampling locations subject to cyclonic flow. Also, you must follow procedures in Method 1 of appendix A-1 to part 60 to determine the presence or absence of cyclonic flow and then perform the following calculations:
(a) As per Section 11.4 of Method 1 of appendix A-1 to part 60, find and record the angle that has a null velocity pressure for each traverse point using an S-type pitot tube.
(b) Average the absolute values of the angles that have a null velocity pressure. Do not use the sampling location if the average absolute value exceeds 20o. (Note: You can minimize the effects of cyclonic flow conditions by moving the sampling location, placing gas flow straighteners upstream of the sampling location, or applying a modified sampling approach as described in EPA Guideline Document GD-008, Particulate Emissions Sampling in Cyclonic Flow. You may need to obtain an alternate method approval from the regulatory authority that established the requirement to use this test method prior to using a modified sampling approach.)
8.3.4 Preliminary Velocity Profile.
Conduct a preliminary velocity traverse by following Method 2 of appendix A-1 to part 60 velocity traverse procedures. The purpose of the preliminary velocity profile is to determine all of the following:
(a) The gas sampling rate for the combined probe/cyclone sampling head in order to meet the required particle size cut.
(b) The appropriate nozzle to maintain the required gas sampling rate for the velocity pressure range and isokinetic range. If the isokinetic range cannot be met (e.g., batch processes, extreme process flow or temperature variation), void the sample or use methods subject to the approval of the Administrator to correct the data. The acceptable variation from isokinetic sampling is 80 to 120 percent and no more than 100 ± 29 percent (two out of 12 or five out of 24) sampling points outside of this criteria.
(c) The necessary sampling duration to obtain sufficient particulate catch weights.
8.3.4.1 Preliminary traverse.
You must use an S-type pitot tube with a conventional thermocouple to conduct the traverse. Conduct the preliminary traverse as close as possible to the anticipated testing time on sources that are subject to hour-by-hour gas flow rate variations of approximately ± 20 percent and/or gas temperature variations of approximately ± 10°C (± 50°F). (Note: You should be aware that these variations can cause errors in the cyclone cut diameters and the isokinetic sampling velocities.)
8.3.4.2 Velocity pressure range.
Insert the S-type pitot tube at each traverse point and record the range of velocity pressures measured on data form in Method 2 of appendix A-1 to part 60. You will use this later to select the appropriate nozzle.
8.3.4.3 Initial gas stream viscosity and molecular weight.
Determine the average gas temperature, average gas oxygen content, average carbon dioxide content, and estimated moisture content. You will use this information to calculate the initial gas stream viscosity (Equation 3) and molecular weight (Equations 1 and 2). (Note: You must follow the instructions outlined in Method 4 of appendix A-3 to part 60 or Alternative Moisture Measurement Method Midget Impingers (ALT-008) to estimate the moisture content. You may use a wet bulb-dry bulb measurement or hand-held hygrometer measurement to estimate the moisture content of sources with gas temperatures less than 71°C (160°F).)
8.3.4.4 Approximate PM concentration in the gas stream.
Determine the approximate PM concentration for the PM2.5 and the PM2.5 to PM10 components of the gas stream through qualitative measurements or estimates from precious stack particulate emissions tests. Having an idea of the particulate concentration in the gas stream is not essential but will help you determine the appropriate sampling time to acquire sufficient PM weight for better accuracy at the source emission level. The collectable PM weight requirements depend primarily on the types of filter media and weighing capabilities that are available and needed to characterize the emissions. Estimate the collectable PM concentrations in the greater than 10 micrometer, less than or equal to 10 micrometers and greater than 2.5 micrometers, and less than or equal to 2.5 micrometer size ranges. Typical PM concentrations are listed in Table 1 of Section 17. Additionally, relevant sections of AP-42, Compilation of Air Pollutant Emission Factors, may contain particle size distributions for processes characterized in those sections, and appendix B2 of AP-42 contains generalized particle size distributions for nine industrial process categories (e.g., stationary internal combustion engines firing gasoline or diesel fuel, calcining of aggregate or unprocessed ores). The generalized particle size distributions can be used if source-specific particle size distributions are unavailable. Appendix B2 of AP-42 also contains typical collection efficiencies of various particulate control devices and example calculations showing how to estimate uncontrolled total particulate emissions, uncontrolled size-specific emissions, and controlled size-specific particulate emissions. (https://www.epa.gov/ttnchie1/ap42.)
8.4 Pre-test Calculations.
You must perform pre-test calculations to help select the appropriate gas sampling rate through cyclone I (PM10) and cyclone IV (PM2.5 .(Choosing the appropriate sampling rate will allow you to maintain the appropriate particle cut diameters based upon preliminary gas stream measurements, as specified in Table 2 of Section 17.
8.4.1 Gas Sampling Rate.
The gas sampling rate is defined by the performance curves for both cyclones, as illustrated in Figure 10 of Section 17. You must use the calculations in Section 8.5 to achieve the appropriate cut size specification for each cyclone. The optimum gas sampling rate is the overlap zone defined as the range below the cyclone IV 2.25 micrometer curve down to the cyclone I 11.0 micrometer curve (area between the two dark, solid lines in Figure 10 of Section 17).
8.4.2 Choosing the Appropriate Sampling Rate.
You must select a gas sampling rate in the middle of the overlap zone (discussed in Section 8.4.1), as illustrated in Figure 10 of Section 17, to maximize the acceptable tolerance for slight variations in flow characteristics at the sampling location. The overlap zone is also a weak function of the gas composition. (Note: The acceptable range is limited, especially for gas streams with temperatures less than approximately 100°F. At lower temperatures, it may be necessary to perform the PM10 and PM2.5 separately in order to meet the necessary particle size criteria shown in Table 2 of Section 17.)
8.5 Test Calculations.
You must perform all of the calculations in Table 3 of Section 17 and the calculations described in Sections 8.5.1 through 8.5.5.
8.5.1 Assumed Reynolds Number.
You must select an assumed Reynolds number (Nre) using Equation 10 and an estimated sampling rate or from prior experience under the stack conditions determined using Methods 1 through 4 to part 60. You will perform initial test calculations based on an assumed Nre for the test to be performed. You must verify the assumed Nre by substituting the sampling rate (Qs) calculated in Equation 7 into Equation 10. Then use Table 5 of Section 17 to determine if the Nre used in Equation 5 was correct.
8.5.2 Final Sampling Rate.
Recalculate the final Qsif the assumed Nre used in your initial calculation is not correct. Use Equation 7 to recalculate the optimum Qs .
8.5.3 Meter Box ΔH.
Use Equation 11 to calculate the meter box orifice pressure drop (ΔH) after you calculate the optimum sampling rate and confirm the Nre. (Note: The stack gas temperature may vary during the test, which could affect the sampling rate. If the stack gas temperature varies, you must make slight adjustments in the meter box ΔH to maintain the correct constant cut diameters. Therefore, use Equation 11 to recalculate the ΔH values for 50°F above and below the stack temperature measured during the preliminary traverse (see Section 8.3.4.1), and document this information in Table 4 of Section 17.)
8.5.4 Choosing a Sampling Nozzle.
Select one or more nozzle sizes to provide for near isokinetic sampling rate (see Section 1.6). This will also minimize an isokinetic sampling error for the particles at each point. First calculate the mean stack gas velocity (vs) using Equation 13. See Section 8.7.2 for information on correcting for blockage and use of different pitot tube coefficients. Then use Equation 14 to calculate the diameter (D) of a nozzle that provides for isokinetic sampling at the mean vs at flow Qs. From the available nozzles one size smaller and one size larger than this diameter, D, select the most appropriate nozzle. Perform the following steps for the selected nozzle.
8.5.4.1 Minimum/maximum nozzle/stack velocity ratio.
Use Equation 15 to determine the velocity of gas in the nozzle. Use Equation 16 to calculate the minimum nozzle/stack velocity ratio (Rmin). Use Equation 17 to calculate the maximum nozzle/stack velocity ratio (Rmax).
8.5.4.2 Minimum gas velocity.
Use Equation 18 to calculate the minimum gas velocity (vmin) if Rmin is an imaginary number (negative value under the square root function) or if Rmin is less than 0.5. Use Equation 19 to calculate vmin if Rmin is ≤ 0.5.
8.5.4.3 Maximum stack velocity.
Use Equation 20 to calculate the maximum stack velocity (vmax) if Rmax is less than 1.5. Use Equation 21 to calculate the stack velocity if Rmax is ≤ 1.5.
8.5.4.4 Conversion of gas velocities to velocity pressure.
Use Equation 22 to convert vmin to minimum velocity pressure, Δpmin. Use Equation 23 to convert vmax to maximum velocity pressure, Δpmax.
8.5.4.5 Comparison to observed velocity pressures.
Compare minimum and maximum velocity pressures with the observed velocity pressures at all traverse points during the preliminary test (see Section 8.3.4.2).
8.5.5 Optimum Sampling Nozzle.
The nozzle you selected is appropriate if all the observed velocity pressures during the preliminary test fall within the range of the Δpmin and Δpmax. Make sure the following requirements are met then follow the procedures in Sections 8.5.5.1 and 8.5.5.2.
(a) Choose an optimum nozzle that provides for isokinetic sampling conditions as close to 100 percent as possible. This is prudent because even if there are slight variations in the gas flow rate, gas temperature, or gas composition during the actual test, you have the maximum assurance of satisfying the isokinetic criteria. Generally, one of the two candidate nozzles selected will be closer to optimum (see Section 8.5.4).
(b) When testing is for PM2.5 only, you are allowed a 16 percent failure rate, rounded to the nearest whole number, of sampling points that are outside the range of the Δpmin and Δpmax. If the coarse fraction for PM10 determination is included, you are allowed only an eight percent failure rate of the sampling points, rounded to the nearest whole number, outside the Δpmin and Δpmax.
8.5.5.1 Precheck.
Visually check the selected nozzle for dents before use.
8.5.5.2 Attach the pre-selected nozzle.
Screw the pre-selected nozzle onto the main body of cyclone I using fluoropolymer tape. Use a union and cascade adaptor to connect the cyclone IV inlet to the outlet of cyclone I (see Figure 2 of Section 17).
8.6 Sampling Train Preparation.
A schematic of the sampling train used in this method is shown in Figure 1 of Section 17. First, assemble the train and complete the leak check on the combined cyclone sampling head and pitot tube. Use the following procedures to prepare the sampling train. (Note: Do not contaminate the sampling train during preparation and assembly. Keep all openings, where contamination can occur, covered until just prior to assembly or until sampling is about to begin.)
8.6.1 Sampling Head and Pitot Tube.
Assemble the combined cyclone train. The O-rings used in the train have a temperature limit of approximately 205°C (400°F). Use cyclones with stainless steel sealing rings for stack temperatures above 205°C (400°F) up to 260°C (500°F). You must also keep the nozzle covered to protect it from nicks and scratches. This method may not be suitable for sources with stack gas temperatures exceeding 260°C (500°F) because the threads of the cyclone components may gall or seize, thus preventing the recovery of the collected PM and rendering the cyclone unusable for subsequent use. You may use stainless steel cyclone assemblies constructed with bolt-together rather than screw-together assemblies at temperatures up to 538°C (1,000°F). You must use “breakaway” or expendable stainless steel bolts that can be overtorqued and broken if necessary to release cyclone closures, thus, allowing you to recover PM without damaging the cyclone flanges or contaminating the samples. You may need to use specialty metals to achieve reliable particulate mass measurements above 538°C (1,000°F). The method can be used at temperatures up to 1,371°C (2,500°F) using specially constructed high-temperature stainless steel alloys (Hastelloy or Haynes 230) with bolt-together closures using break-away bolts.
8.6.2 Filterable Particulate Filter Holder and Pitot Tube.
Attach the pre-selected filter holder to the end of the combined cyclone sampling head (see Figure 2 of Section 17). Attach the S-type pitot tube to the combined cyclones after the sampling head is fully attached to the end of the probe. (Note: The pitot tube tip must be mounted slightly beyond the combined head cyclone sampling assembly and at least one inch off the gas flow path into the cyclone nozzle. This is similar to the pitot tube placement in Method 17 of appendix A-6 to part 60.) Securely fasten the sensing lines to the outside of the probe to ensure proper alignment of the pitot tube. Provide unions on the sensing lines so that you can connect and disconnect the S-type pitot tube tips from the combined cyclone sampling head before and after each run. Calibrate the pitot tube on the sampling head according to the most current ASTM International D3796 because the cyclone body is a potential source flow disturbance and will change the pitot coefficient value from the baseline (isolated tube) value.
8.6.3 Filter.
Let Clean Air Help you with tared media!
We can provide you with tared filters and provide post-test analysis! Contact us today! Yes, we are NELAC accredited!
You must number and tare the filters before use. To tare the filters, desiccate each filter at 20 ± 5.6°C (68 ± l0°F) and ambient pressure for at least 24 hours and weigh at intervals of at least six hours to a constant weight. (See Section 3.0 for a definition of constant weight.) Record results to the nearest 0.l mg. During each weighing, the filter must not be exposed to the laboratory atmosphere for longer than two minutes and a relative humidity above 50 percent. Alternatively, the filters may be oven-dried at l04°C (220°F) for two to three hours, desiccated for two hours, and weighed. Use tweezers or clean disposable surgical gloves to place a labeled (identified) and pre-weighed filter in the filter holder. You must center the filter and properly place the gasket so that the sample gas stream will not circumvent the filter. The filter must not be compressed between the gasket and the filter housing. Check the filter for tears after the assembly is completed. Then screw or clamp the filter housing together to prevent the seal from leaking.
8.6.4 Moisture Trap.
If you are measuring only filterable particulate (or you are sure that the gas filtration temperature will be maintained below 30°C (85°F)), then an empty modified Greenburg Smith impinger followed by an impinger containing silica gel is required. Alternatives described in Method 5 of appendix A-3 to part 60 may also be used to collect moisture that passes through the ambient filter. If you are measuring condensable PM in combination with this method, then follow the procedures in Method 202 of appendix M of this part for moisture collection.
8.6.5 Leak Check.
Use the procedures outlined in Section 8.4 of Method 5 of appendix A-3 to part 60 to leak check the entire sampling system. Specifically perform the following procedures:
8.6.5.1 Sampling train.
You must pretest the entire sampling train for leaks. The pretest leak check must have a leak rate of not more than 0.02 actual cubic feet per minute or four percent of the average sample flow during the test run, whichever is less. Additionally, you must conduct the leak check at a vacuum equal to or greater than the vacuum anticipated during the test run. Enter the leak check results on the analytical data sheet (see Section 11.1) for the specific test. (Note: Do not conduct a leak check during port changes.)
8.6.5.2 Pitot tube assembly.
After you leak check the sample train, perform a leak check of the pitot tube assembly. Follow the procedures outlined in Section 8.4.1 of Method 5 of appendix A-3 to part 60.
8.6.6 Sampling Head.
You must preheat the combined sampling head to the stack temperature of the gas stream at the test location (± 10°C, ± 50°F). This will heat the sampling head and prevent moisture from condensing from the sample gas stream.
8.6.6.1 Warmup.
You must complete a passive warmup (of 30-40 min) within the stack before the run begins to avoid internal condensation.
8.6.6.2 Shortened warmup.
You can shorten the warmup time by thermostated heating outside the stack (such as by a heat gun). Then place the heated sampling head inside the stack and allow the temperature to equilibrate.
8.7 Sampling Train Operation.
Operate the sampling train the same as described in Section 4.1.5 of Method 5 of appendix A-3 to part 60, but use the procedures in this section for isokinetic sampling and flow rate adjustment. Maintain the flow rate calculated in Section 8.4.1 throughout the run, provided the stack temperature is within 28°C (50°F) of the temperature used to calculate ΔH. If stack temperatures vary by more than 28°C (50°F), use the appropriate ΔH value calculated in Section 8.5.3. Determine the minimum number of traverse points as in Figure 7 of Section 17. Determine the minimum total projected sampling time based on achieving the data quality objectives or emission limit of the affected facility. We recommend that you round the number of minutes sampled at each point to the nearest 15 seconds. Perform the following procedures:
8.7.1 Sample Point Dwell Time.
You must calculate the flow rate-weighted dwell time (that is, sampling time) for each sampling point to ensure that the overall run provides a velocity-weighted average that is representative of the entire gas stream. Vary the dwell time at each traverse point proportionately with the point velocity. Calculate the dwell time at each of the traverse points using Equation 24. You must use the data from the preliminary traverse to determine the average velocity pressure (Δpavg). You must use the velocity pressure measured during the sampling run to determine the velocity pressure at each point (Δpn). Here, Ntp equals the total number of traverse points. Each traverse point must have a dwell time of at least two minutes.
8.7.2 Adjusted Velocity Pressure.
When selecting your sampling points using your preliminary velocity traverse data, your preliminary velocity pressures must be adjusted to take into account the increase in velocity due to blockage. Also, you must adjust your preliminary velocity data for differences in pitot tube coefficients. Use the following instructions to adjust the preliminary velocity pressure.
8.7.2.1 Different pitot tube coefficient.
You must use Equation 25 to correct the recorded preliminary velocity pressures if the pitot tube mounted on the combined cyclone sampling head has a different pitot tube coefficient than the pitot tube used during the preliminary velocity traverse (see Section 8.3.4).
8.7.2.2 Probe blockage factor.
You must use Equation 26 to calculate an average probe blockage correction factor (bf) if the diameter of your stack or duct is between 25.7 and 36.4 inches for the combined PM2.5/PM10 sampling head and pitot and between 18.8 and 26.5 inches for the PM2.5 cyclone and pitot. A probe blockage factor is calculated because of the flow blockage caused by the relatively large crosssectional area of the cyclone sampling head, as discussed in Section 8.3.2.2 and illustrated in Figures 8 and 9 of Section 17. You must determine the cross-sectional area of the cyclone head you use and determine its stack blockage factor. (Note: Commercially-available sampling heads (including the PM10 cyclone, PM2.5 cyclone, pitot and filter holder) have a projected area of approximately 31.2 square inches when oriented into the gas stream. As the probe is moved from the most outer to the most inner point, the amount of blockage that actually occurs ranges from approximately 13 square inches to the full 31.2 inches plus the blockage caused by the probe extension. The average cross-sectional area blocked is 22 square inches.)
8.7.2.3 Final adjusted velocity pressure.
Calculate the final adjusted velocity pressure (Δps2) using Equation 27. (Note: Figures 8 and 9 of Section 17 illustrate that the blockage effect of the combined PM10, PM2.5 cyclone sampling head, and pitot tube increases rapidly below stack diameters of 26.5 inches. Therefore, the combined PM10 ,PM2.5 filter sampling head and pitot tube is not applicable for stacks with a diameter less than 26.5 inches because the blockage is greater than six percent. For stacks with a diameter less than 26.5 inches, PM2.5 particulate measurements may be possible using only a PM2.5 cyclone, pitot tube, and in-stack filter. If the blockage exceeds three percent but is less than six percent, you must follow the procedures outlined in Method 1A of appendix A-1 to part 60 to conduct tests. You must conduct the velocity traverse downstream of the sampling location or immediately before the test run.
8.7.3 Sample Collection.
Collect samples the same as described in Section 4.1.5 of Method 5 of appendix A-3 to part 60, except use the procedures in this section for isokinetic sampling and flow rate adjustment. Maintain the flow rate calculated in Section 8.5 throughout the run, provided the stack temperature is within 28°C (50°F) of the temperature used to calculate ΔH. If stack temperatures vary by more than 28°C (50°F), use the appropriate ΔH value calculated in Section 8.5.3. Calculate the dwell time at each traverse point as in Equation 24. In addition to these procedures, you must also use running starts and stops if the static pressure at the sampling location is less than minus 5 inches water column. This prevents back pressure from rupturing the sample filter. If you use a running start, adjust the flow rate to the calculated value after you perform the leak check (see Section 8.4).
8.7.3.1 Level and zero manometers.
Periodically check the level and zero point of the manometers during the traverse. Vibrations and temperature changes may cause them to drift.
8.7.3.2 Portholes.
Clean the portholes prior to the test run. This will minimize the chance of collecting deposited material in the nozzle.
8.7.3.3 Sampling procedures.
Verify that the combined cyclone sampling head temperature is at stack temperature. You must maintain the temperature of the cyclone sampling head within ± 10°C (± 18°F) of the stack temperature. (Note: For many stacks, portions of the cyclones and filter will be external to the stack during part of the sampling traverse. Therefore, you must heat and/or insulate portions of the cyclones and filter that are not within the stack in order to maintain the sampling head temperature at the stack temperature. Maintaining the temperature will ensure proper particle sizing and prevent condensation on the walls of the cyclones.) To begin sampling, remove the protective cover from the nozzle. Position the probe at the first sampling point with the nozzle pointing directly into the gas stream. Immediately start the pump and adjust the flow to calculated isokinetic conditions. Ensure the probe/pitot tube assembly is leveled. (Note: When the probe is in position, block off the openings around the probe and porthole to prevent unrepresentative dilution of the gas stream. Take care to minimize contamination from material used to block the flow or insulate the sampling head during collection at the first sampling point.)
(a) Traverse the stack cross-section, as required by Method 1 of appendix A-1 to part 60, with the exception that you are only required to perform a 12-point traverse. Do not bump the cyclone nozzle into the stack walls when sampling near the walls or when removing or inserting the probe through the portholes. This will minimize the chance of extracting deposited materials.
(b) Record the data required on the field test data sheet for each run. Record the initial dry gas meter reading. Then take dry gas meter readings at the following times: the beginning and end of each sample time increment; when changes in flow rates are made; and when sampling is halted. Compare the velocity pressure measurements (Equations 22 and 23) with the velocity pressure measured during the preliminary traverse. Keep the meter box ΔH at the value calculated in Section 8.5.3 for the stack temperature that is observed during the test. Record all point-by-point data and other source test parameters on the field test data sheet. Do not leak check the sampling system during port changes.
(c) Maintain flow until the sampling head is completely removed from the sampling port. You must restart the sampling flow prior to inserting the sampling head into the sampling port during port changes.
(d) Maintain the flow through the sampling system at the last sampling point. At the conclusion of the test, remove the pitot tube and combined cyclone sampling head from the stack while the train is still operating (running stop). Make sure that you do not scrape the pitot tube or the combined cyclone sampling head against the port or stack walls. Then stop the pump and record the final dry gas meter reading and other test parameters on the field test data sheet. (Note: After you stop the pump, make sure you keep the combined cyclone head level to avoid tipping dust from the cyclone cups into the filter and/or down-comer lines.)
8.7.4 Process Data.
You must document data and information on the process unit tested, the particulate control system used to control emissions, any nonparticulate control system that may affect particulate emissions, the sampling train conditions, and weather conditions. Record the site barometric pressure and stack pressure on the field test data sheet. Discontinue the test if the operating conditions may cause nonrepresentative particulate emissions.
8.7.4.1 Particulate control system data.
Use the process and control system data to determine whether representative operating conditions were maintained throughout the testing period.
8.7.4.2 Sampling train data.
Use the sampling train data to confirm that the measured particulate emissions are accurate and complete.
8.7.5 Sample Recovery.
First remove the sampling head (combined cyclone/filter assembly) from the train probe. After the sample head is removed, perform a posttest leak check of the probe and sample train. Then recover the components from the cyclone/filter. Refer to the following sections for more detailed information.
8.7.5.1 Remove sampling head.
After cooling and when the probe can be safely handled, wipe off all external surfaces near the cyclone nozzle and cap the inlet to the cyclone to prevent PM from entering the assembly. Remove the combined cyclone/filter sampling head from the probe. Cap the outlet of the filter housing to prevent PM from entering the assembly.
8.7.5.2 Leak check probe/sample train assembly (posttest).
Leak check the remainder of the probe and sample train assembly (including meter box) after removing the combined cyclone head/filter. You must conduct the leak rate at a vacuum equal to or greater than the maximum vacuum achieved during the test run. Enter the results of the leak check onto the field test data sheet. If the leak rate of the sampling train (without the combined cyclone sampling head) exceeds 0.02 actual cubic feet per minute or four percent of the average sampling rate during the test run (whichever is less), the run is invalid and must be repeated.
8.7.5.3 Weigh or measure the volume of the liquid collected in the water collection impingers and silica trap.
Measure the liquid in the first impingers to within 1 ml using a clean graduated cylinder or by weighing it to within 0.5 g using a balance. Record the volume of the liquid or weight of the liquid present to be used to calculate the moisture content of the effluent gas.
8.7.5.4 Weigh the silica impinger.
If a balance is available in the field, weigh the silica impinger to within 0.5 g. Note the color of the indicating silica gel in the last impinger to determine whether it has been completely spent and make a notation of its condition. If you are measuring CPM in combination with this method, the weight of the silica gel can be determined before or after the post-test nitrogen purge is complete (See Section 8.5.3 of Method 202 of appendix M to this part).
8.7.5.5 Recovery of PM.
Recovery involves the quantitative transfer of particles in the following size range: greater than 10 micrometers; less than or equal to 10 micrometers but greater than 2.5 micrometers; and less than or equal to 2.5 micrometers. You must use a nylon or fluoropolymer brush and an acetone rinse to recover particles from the combined cyclone/filter sampling head. Use the following procedures for each container:
(a) Container #1, Less than or equal to PM2.5micrometer filterable particulate. Use tweezers and/or clean disposable surgical gloves to remove the filter from the filter holder. Place the filter in the Petri dish that you labeled with the test identification and Container #1. Using a dry brush and/or a sharp-edged blade, carefully transfer any PM and/or filter fibers that adhere to the filter holder gasket or filter support screen to the Petri dish. Seal the container. This container holds particles less than or equal to 2.5 micrometers that are caught on the in-stack filter. (Note: If the test is conducted for PM10 only, then Container #1 would be for less than or equal to PM2.5 micrometer filterable particulate.)
(b) Container #2, Greater than PM10 micrometer filterable particulate. Quantitatively recover the PM from the cyclone I cup and brush cleaning and acetone rinses of the cyclone cup, internal surface of the nozzle, and cyclone I internal surfaces, including the outside surface of the downcomer line. Seal the container and mark the liquid level on the outside of the container you labeled with test identification and Container #2. You must keep any dust found on the outside of cyclone I and cyclone nozzle external surfaces out of the sample. This container holds PM greater than 10 micrometers.
(c) Container #3, Filterable particulate less than or equal to 10 micrometer and greater than 2.5 micrometers. Place the solids from cyclone cup IV and the acetone (and brush cleaning) rinses of the cyclone I turnaround cup (above inner downcomer line), inside of the downcomer line, and interior surfaces of cyclone IV into Container #3. Seal the container and mark the liquid level on the outside of the container you labeled with test identification and Container #3. This container holds PM less than or equal to 10 micrometers but greater than 2.5 micrometers.
(d) Container #4, Less than or equal to PM2.5micrometers acetone rinses of the exit tube of cyclone IV and front half of the filter holder. Place the acetone rinses (and brush cleaning) of the exit tube of cyclone IV and the front half of the filter holder in container #4. Seal the container and mark the liquid level on the outside of the container you labeled with test identification and Container #4. This container holds PM that is less than or equal to 2.5 micrometers.
(e) Container #5, Cold impinger water. If the water from the cold impinger used for moisture collection has been weighed in the field, it can be discarded. Otherwise, quantitatively transfer liquid from the cold impinger that follows the ambient filter into a clean sample bottle (glass or plastic). Mark the liquid level on the bottle you labeled with test identification and Container #5. This container holds the remainder of the liquid water from the emission gases. If you collected condensable PM using Method 202 of appendix M to this part in conjunction with using this method, you must follow the procedures in Method 202 of appendix M to this part to recover impingers and silica used to collect moisture.
(f) Container #6, Silica gel absorbent. Transfer the silica gel to its original container labeled with test identification and Container #6 and seal. A funnel may make it easier to pour the silica gel without spilling. A rubber policeman may be used as an aid in removing the silica gel from the impinger. It is not necessary to remove the small amount of silica gel dust particles that may adhere to the impinger wall and are difficult to remove. Since the gain in weight is to be used for moisture calculations, do not use any water or other liquids to transfer the silica gel. If the silica gel has been weighed in the field to measure water content, it can be discarded. Otherwise, the contents of Container #6 are weighed during sample analysis.
(g) Container #7, Acetone field reagent blank. Take approximately 200 ml of the acetone directly from the wash bottle you used and place it in Container #7 labeled “Acetone Field Reagent Blank.”
8.7.6 Transport Procedures.
Containers must remain in an upright position at all times during shipping. You do not have to ship the containers under dry or blue ice.
9.0 Quality Control
9.1 Daily Quality Checks.
You must perform daily quality checks of field log books and data entries and calculations using data quality indicators from this method and your site-specific test plan. You must review and evaluate recorded and transferred raw data, calculations, and documentation of testing procedures. You must initial or sign log book pages and data entry forms that were reviewed.
9.2 Calculation Verification.
Verify the calculations by independent, manual checks. You must flag any suspect data and identify the nature of the problem and potential effect on data quality. After you complete the test, prepare a data summary and compile all the calculations and raw data sheets.
9.3 Conditions.
You must document data and information on the process unit tested, the particulate control system used to control emissions, any nonparticulate control system that may affect particulate emissions, the sampling train conditions, and weather conditions. Discontinue the test if the operating conditions may cause non-representative particulate emissions.
9.4 Field Analytical Balance Calibration Check.
Perform calibration check procedures on field analytical balances each day that they are used. You must use National Institute of Standards and Technology (NIST)-traceable weights at a mass approximately equal to the weight of the sample plus container you will weigh.
10.0 Calibration and Standardization
Maintain a log of all filterable particulate sampling and analysis calibrations. Include copies of the relevant portions of the calibration and field logs in the final test report.
10.1 Gas Flow Velocities.
You must use an S-type pitot tube that meets the required EPA specifications (EPA Publication 600/4-77-0217b) during these velocity measurements. (Note: If, as specified in Section 8.7.2.3, testing is performed in stacks less than 26.5 inches in diameter, testers may use a standard pitot tube according to the requirements in Method 4A or 5 of appendix A-3 to part 60.) You must also complete the following:
(a) Visually inspect the S-type pitot tube before sampling.
(b) Leak check both legs of the pitot tube before and after sampling.
(c) Maintain proper orientation of the S-type pitot tube while making measurements.
10.1.1 S-type Pitot Tube Orientation.
The S-type pitot tube is properly oriented when the yaw and the pitch axis are 90 degrees to the air flow.
10.1.2 Average Velocity Pressure Record.
Instead of recording either high or low values, record the average velocity pressure at each point during flow measurements.
10.1.3 Pitot Tube Coefficient.
Determine the pitot tube coefficient based on physical measurement techniques described in Method 2 of appendix A-1 to part 60. (Note: You must calibrate the pitot tube on the sampling head because of potential interferences from the cyclone body. Refer to Section 8.7.2 for additional information.)
10.2 Thermocouple Calibration.
You must calibrate the thermocouples using the procedures described in Section 10.3.1 of Method 2 of appendix A-1 to part 60 or Alternative Method 2 Thermocouple Calibration (ALT-011). Calibrate each temperature sensor at a minimum of three points over the anticipated range of use against a NISTtraceable thermometer. Alternatively, a reference thermocouple and potentiometer calibrated against NIST standards can be used.
10.3 Nozzles.
You may use stainless steel (316 or equivalent), high-temperature steel alloy, or fluoropolymer-coated nozzles for isokinetic sampling. Make sure that all nozzles are thoroughly cleaned, visually inspected, and calibrated according to the procedure outlined in Section 10.1 of Method 5 of appendix A-3 to part 60.
10.4 Dry Gas Meter Calibration.
Calibrate your dry gas meter following the calibration procedures in Section 16.1 of Method 5 of appendix A-3 to part 60. Also, make sure you fully calibrate the dry gas meter to determine the volume correction factor prior to field use. Post-test calibration checks must be performed as soon as possible after the equipment has been returned to the shop. Your pre-test and post-test calibrations must agree within ± 5 percent.
10.5 Glassware.
Use class A volumetric glassware for titrations, or calibrate your equipment against NISTtraceable glassware.
11.0 Analytical Procedures
Let Clean Air help you with the Analysis!
Learn about our gravimetric particulate analysis capabilities or more about Method 201A analysis, or contact our Laboratory Team to send us your samples today!
11.1 Analytical Data Sheet.
Record all data on the analytical data sheet. Obtain the data sheet from Figure 5-6 of Method 5 of appendix A-3 to part 60. Alternatively, data may be recorded electronically using software applications such as the Electronic Reporting Tool located at https://www.epa.gov/ttn/chief/ert/ert_tool.html.
11.2 Dry Weight of PM.
Determine the dry weight of particulate following procedures outlined in this section.
11.2.1 Container #1
Less than or Equal to PM2.5Micrometer Filterable Particulate. Transfer the filter and any loose particulate from the sample container to a tared weighing dish or pan that is inert to solvent or mineral acids. Desiccate for 24 hours in a dessicator containing anhydrous calcium sulfate. Weigh to a constant weight and report the results to the nearest 0.1 mg. (See Section 3.0 for a definition of Constant weight.) If constant weight requirements cannot be met, the filter must be treated as described in Section 11.2.1 of Method 202 of appendix M to this part. Extracts resulting from the use of this procedure must be filtered to remove filter fragments before the filter is processed and weighed.
11.2.2 Container #2
Greater than PM10 Micrometer Filterable Particulate Acetone Rinse. Separately treat this container like Container #4.
11.2.3 Container #3
Filterable Particulate Less than or Equal to 10 Micrometer and Greater than 2.5 Micrometers Acetone Rinse. Separately treat this container like Container #4.
11.2.4 Container #4
Less than or Equal to PM2.5Micrometers Acetone Rinse of the Exit Tube of Cyclone IV and Front Half of the Filter Holder. Note the level of liquid in the container and confirm on the analysis sheet whether leakage occurred during transport. If a noticeable amount of leakage has occurred, either void the sample or use methods (subject to the approval of the Administrator) to correct the final results. Quantitatively transfer the contents to a tared 250 ml beaker or tared fluoropolymer beaker liner, and evaporate to dryness at room temperature and pressure in a laboratory hood. Desiccate for 24 hours and weigh to a constant weight. Report the results to the nearest 0.1 mg.
11.2.5 Container #5
Cold Impinger Water. If the amount of water has not been determined in the field, note the level of liquid in the container and confirm on the analysis sheet whether leakage occurred during transport. If a noticeable amount of leakage has occurred, either void the sample or use methods (subject to the approval of the Administrator) to correct the final results. Measure the liquid in this container either volumetrically to ± 1 ml or gravimetrically to ± 0.5 g.
11.2.6 Container #6
Silica Gel Absorbent. Weigh the spent silica gel (or silica gel plus impinger) to the nearest 0.5 g using a balance. This step may be conducted in the field.
11.2.7 Container #7
Acetone Field Reagent Blank. Use 150 ml of acetone from the blank container used for this analysis. Transfer 150 ml of the acetone to a clean 250-ml beaker or tared fluoropolymer beaker liner. Evaporate the acetone to dryness at room temperature and pressure in a laboratory hood. Following evaporation, desiccate the residue for 24 hours in a desiccator containing anhydrous calcium sulfate. Weigh and report the results to the nearest 0.1 mg.
12.0 Calculations and Data Analysis
12.1 Nomenclature.
Report results in International System of Units (SI units) unless the regulatory authority that established the requirement to use this test method specifies reporting in English units. The following nomenclature is used.
| A | = | Area of stack or duct at sampling location, square inches. |
| An | = | Area of nozzle, square feet. |
| bf | = | Average blockage factor calculated in Equation 26, dimensionless. |
| Bws | = | Moisture content of gas stream, fraction (e.g., 10 percent H2O is Bws = 0.10). |
| C | = | Cunningham correction factor for particle diameter, Dp, and calculated using the actual stack gas temperature, dimensionless. |
| %CO2 | = | Carbon Dioxide content of gas stream, percent by volume. |
| Ca | = | Acetone blank concentration, mg/mg. |
| CfPM10 | = | Conc. of filterable PM10, gr/DSCF. |
| CfPM2.5 | = | Conc. of filterable PM2.5, gr/DSCF. |
| Cp | = | Pitot coefficient for the combined cyclone pitot, dimensionless. |
| Cp' | = | Coefficient for the pitot used in the preliminary traverse, dimensionless. |
| Cr | = | Re-estimated Cunningham correction factor for particle diameter equivalent to the actual cut size diameter and calculated using the actual stack gas temperature, dimensionless. |
| Ctf | = | Conc. of total filterable PM, gr/DSCF. |
| C1 | = | -150.3162 (micropoise) |
| C2 | = | 18.0614 (micropoise/K0.5) |
| = | 13.4622 (micropoise/R0.5) | |
| C3 | = | 1.19183 × 10⁶ (micropoise/K2) |
| = | 3.86153 × 10⁶ (micropoise/R2) | |
| C4 | = | 0.591123 (micropoise) |
| C5 | = | 91.9723 (micropoise) |
| C6 | = | 4.91705 × 10⁻⁵ (micropoise/K2) |
| = | 1.51761 × 10⁻⁵ (micropoise/R2) | |
| D | = | Inner diameter of sampling nozzle mounted on Cyclone I, inches. |
| Dp | = | Physical particle size, micrometers. |
| D50 | = | Particle cut diameter, micrometers. |
| D50-1 | = | Re-calculated particle cut diameters based on re-estimated Cr, micrometers. |
| D50LL | = | Cut diameter for cyclone I corresponding to the 2.25 micrometer cut diameter for cyclone IV, micrometers. |
| D50N | = | D50 value for cyclone IV calculated during the Nth iterative step, micrometers. |
| D50(N+1) | = | D50 value for cyclone IV calculated during the N+1 iterative step, micrometers. |
| D50T | = | Cyclone I cut diameter corresponding to the middle of the overlap zone shown in Figure 10 of Section 17, micrometers. |
| I | = | Percent isokinetic sampling, dimensionless. |
| Kp | = | 85.49, ((ft/sec)/(pounds/mole -°R)). |
| ma | = | Mass of residue of acetone after evaporation, mg. |
| Md | = | Molecular weight of dry gas, pounds/pound mole. |
| mg | = | Milligram. |
| mg/L | = | Milligram per liter. |
| Mw | = | Molecular weight of wet gas, pounds/pound mole. |
| M1 | = | Milligrams of PM collected on the filter, less than or equal to 2.5 micrometers. |
| M2 | = | Milligrams of PM recovered from Container #2 (acetone blank corrected), greater than 10 micrometers. |
| M3 | = | Milligrams of PM recovered from Container #3 (acetone blank corrected), less than or equal to 10 and greater than 2.5 micrometers. |
| M4 | = | Milligrams of PM recovered from Container #4 (acetone blank corrected), less than or equal to 2.5 micrometers. |
| Ntp | = | Number of iterative steps or total traverse points. |
| Nre | = | Reynolds number, dimensionless. |
| %O2,wet | = | Oxygen content of gas stream, % by volume of wet gas. (Note: The oxygen percentage used in Equation 3 is on a wet gas basis. That means that since oxygen is typically measured on a dry gas basis, the measured percent O2 must be multiplied by the quantity (1 - Bws) to convert to the actual volume fraction. Therefore, %O2,wet = (1 - Bws) * %O2,dry) |
| Pbar | = | Barometric pressure, inches Hg. |
| Ps | = | Absolute stack gas pressure, inches Hg. |
| Qs | = | Sampling rate for cyclone I to achieve specified D50. |
| QsST | = | Dry gas sampling rate through the sampling assembly, DSCFM. |
| QI | = | Sampling rate for cyclone I to achieve specified D50. |
| Rmax | = | Nozzle/stack velocity ratio parameter, dimensionless. |
| Rmin | = | Nozzle/stack velocity ratio parameter, dimensionless. |
| Tm | = | Meter box and orifice gas temperature, °R. |
| tn | = | Sampling time at point n, min. |
| tr | = | Total projected run time, min. |
| Ts | = | Absolute stack gas temperature, °R. |
| t1 | = | Sampling time at point 1, min. |
| vmax | = | Maximum gas velocity calculated from Equations 18 or 19, ft/sec. |
| vmin | = | Minimum gas velocity calculated from Equations 16 or 17, ft/sec. |
| vn | = | Sample gas velocity in the nozzle, ft/sec. |
| vs | = | Velocity of stack gas, ft/sec. |
| Va | = | Volume of acetone blank, ml. |
| Vaw | = | Volume of acetone used in sample recovery wash, ml. |
| Vc | = | Quantity of water captured in impingers and silica gel, ml. |
| Vm | = | Dry gas meter volume sampled, ACF. |
| Vms | = | Dry gas meter volume sampled, corrected to standard conditions, DSCF. |
| Vws | = | Volume of water vapor, SCF. |
| Vb | = | Volume of aliquot taken for IC analysis, ml. |
| Vic | = | Volume of impinger contents sample, ml. |
| Wa | = | Weight of blank residue in acetone used to recover samples, mg. |
| W2,3,4 | = | Weight of PM recovered from Containers #2, #3, and #4, mg. |
| Z | = | Ratio between estimated cyclone IV D50 values, dimensionless. |
| ΔH | = | Meter box orifice pressure drop, inches W.C. |
| ΔH@ | = | Pressure drop across orifice at flow rate of 0.75 SCFM at standard conditions, inches W.C. (Note: Specific to each orifice and meter box.) |
| [(Δp)0.5]avg | = | Average of square roots of the velocity pressures measured during the preliminary traverse, inches W.C. |
| Δpm | = | Observed velocity pressure using S-type pitot tube in preliminary traverse, inches W.C. |
| Δpavg | = | Average velocity pressure, inches W.C. |
| Δpmax | = | Maximum velocity pressure, inches W.C. |
| Δpmin | = | Minimum velocity pressure, inches W.C. |
| Δpn | = | Velocity pressure measured at point n during the test run, inches W.C. |
| Δps | = | Velocity pressure calculated in Equation 25, inches W.C. |
| Δps1 | = | Velocity pressure adjusted for combined cyclone pitot tube, inches W.C. |
| Δps2 | = | Velocity pressure corrected for blockage, inches W.C. |
| Δp1 | = | Velocity pressure measured at point 1, inches W.C. |
| ϒ | = | Dry gas meter gamma value, dimensionless. |
| μ | = | Gas viscosity, micropoise. |
| θ | = | Total run time, min. |
| ρa | = | Density of acetone, mg/ml (see label on bottle). |
| 12.0 | = | Constant calculated as 60 percent of 20.5 square inch cross-sectional area of combined cyclone head, square inches. |
12.2 Calculations.
Perform all of the calculations found in Table 6 of Section 17. Table 6 of Section 17 also provides instructions and references for the calculations.
12.3 Analyses.
Analyze D50 of cyclone IV and the concentrations of the PM in the various size ranges.
12.3.1 D50 of Cyclone IV.
To determine the actual D50for cyclone IV, recalculate the Cunningham correction factor and the Reynolds number for the best estimate of cyclone IV D50 The following sections describe additional .information on how to recalculate the Cunningham correction factor and determine which Reynolds number to use.
12.3.1.1 Cunningham correction factor.
Recalculate the initial estimate of the Cunningham correction factor using the actual test data. Insert the actual test run data and D50 of 2.5 micrometers into Equation 4. This will give you a new Cunningham correction factor based on actual data.
12.3.1.2 Initial D50 for cyclone IV.
Determine the initial estimate for cyclone IV D50 using the test condition Reynolds number calculated with Equation 10 as indicated in Table 3 of Section 17. Refer to the following instructions.
(a) If the Reynolds number is less than 3,162, calculate the D50 for cyclone IV with Equation 34, using actual test data.
(b) If the Reynolds number is greater than or equal to 3,162, calculate the D50 for cyclone IV with Equation 35 using actual test data.
(c) Insert the “new” D50 value calculated by either Equation 34 or 35 into Equation 36 to re-establish the Cunningham Correction Factor (Cr). (Note: Use the test condition calculated Reynolds number to determine the most appropriate equation (Equation 34 or 35).)
12.3.1.3 Re-establish cyclone IV D50.
Use the reestablished Cunningham correction factor (calculated in the previous step) and the calculated Reynolds number to determine D50-1.
(a) Use Equation 37 to calculate the re-established cyclone IV D50-1 if the Reynolds number is less than 3,162.
(b) Use Equation 38 to calculate the re-established cyclone IV D50-1 if the Reynolds number is greater than or equal to 3,162.
12.3.1.4 Establish “Z” values.
The “Z” value is the result of an analysis that you must perform to determine if the Cr is acceptable. Compare the calculated cyclone IV D50 (either Equation 34 or 35) to the re-established cyclone IV D50-1 (either Equation 36 or 37) values based upon the test condition calculated Reynolds number (Equation 39). Follow these procedures.
(a) Use Equation 39 to calculate the “Z” values. If the “Z” value is between 0.99 and 1.01, the D50-1 value is the best estimate of the cyclone IV D50 cut diameter for your test run.
(b) If the “Z” value is greater than 1.01 or less than 0.99, re-establish a Cr based on the D50-1 value determined in either Equations 36 or 37, depending upon the test condition Reynolds number.
(c) Use the second revised Cr to re-calculate the cyclone IV D50.
(d) Repeat this iterative process as many times as necessary using the prescribed equations until you achieve the criteria documented in Equation 40.
12.3.2 Particulate Concentration.
Use the particulate catch weights in the combined cyclone sampling train to calculate the concentration of PM in the various size ranges. You must correct the concentrations for the acetone blank.
12.3.2.1 Acetone blank concentration.
Use Equation 42 to calculate the acetone blank concentration (Ca.)
12.3.2.2 Acetone blank residue weight.
Use Equation 44 to calculate the acetone blank weight (Wa(2,3,4).) Subtract the weight of the acetone blank from the particulate weight catch in each size fraction.
12.3.2.3 Particulate weight catch per size fraction.
Correct each of the PM weights per size fraction by subtracting the acetone blank weight (i.e., M2,3,4-Wa.)
(Note: Do not subtract a blank value of greater than 0.1 mg per 100 ml of the acetone used from the sample recovery.) Use the following procedures.
(a) Use Equation 45 to calculate the PM recovered from Containers #1, #2, #3, and #4. This is the total collectable PM (Ctf.)
(b) Use Equation 46 to determine the quantitative recovery of PM10 (CfPM10) from Containers #1, #3, and #4.
(c) Use Equation 47 to determine the quantitative recovery of PM2.5 (CfPM2.5) recovered from Containers #1 and #4.
12.4 Reporting.
You must prepare a test report following the guidance in EPA Guidance Document 043, Preparation and Review of Test Reports (December 1998).
12.5 Equations.
Use the following equations to complete the calculations required in this test method.
Molecular Weight of Dry Gas.
Calculate the molecular weight of the dry gas using Equation 1.
 (Eq. 1)
Molecular Weight of Wet Gas.
Calculate the molecular weight of the stack gas on a wet basis using Equation 2.
 (Eq. 2)
Gas Stream Viscosity.
Calculate the gas stream viscosity using Equation 3. This equation uses constants for gas temperatures in °R.
 (Eq. 3)
Cunningham Correction Factor.
The Cunningham correction factor is calculated for a 2.25 micrometer diameter particle.
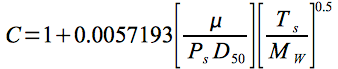 (Eq. 4)
Lower Limit Cut Diameter for Cyclone I for Nre Less than 3,162.
The Cunningham correction factor is calculated for a 2.25 micrometer diameter particle.
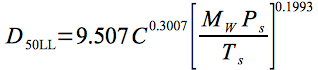 (Eq. 5)
Cut Diameter for Cyclone I for the Middle of the Overlap Zone.
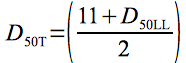 (Eq. 6)
Sampling Rate Using Both PM10 and PM2.5 Cyclones.
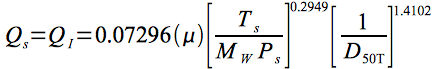 (Eq. 7)
Sampling Rate Using Only PM2.5 Cyclone.
For Nre Less than 3,162:
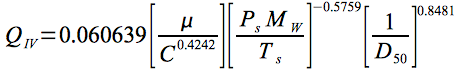 (Eq. 8)
For Nre greater than or equal to 3,162:
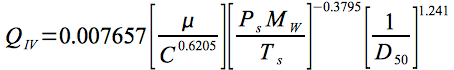 (Eq. 9)
Reynolds Number.
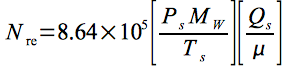 (Eq. 10)
Meter Box Orifice Pressure Drop.
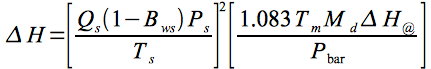 (Eq. 11)
Lower Limit Cut Diameter for Cyclone I for Nre Greater than or Equal to 3,162.
The Cunningham correction factor is calculated for a 2.25 micrometer diameter particle.
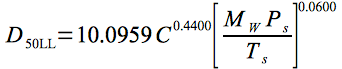 (Eq. 12)
Velocity of Stack Gas.
Correct the mean preliminary velocity pressure for Cp and blockage using Equations 25, 26, and 27.
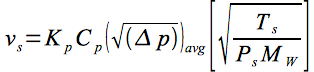 (Eq. 13)
Calculated Nozzle Diameter for Acceptable Sampling Rate.
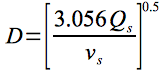 (Eq. 14)
Velocity of Gas in Nozzle.
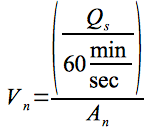 (Eq. 15)
Minimum Nozzle/Stack Velocity Ratio Parameter.
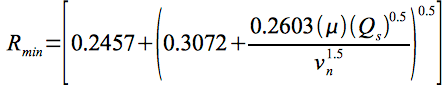 (Eq. 16)
Maximum Nozzle/Stack Velocity Ratio Parameter.
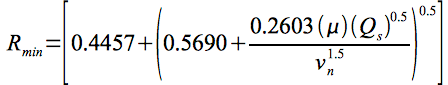 (Eq. 17)
Minimum Gas Velocity for Rmin Less than 0.5.
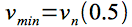 (Eq. 18)
Minimum Gas Velocity for Rmin Greater than or Equal to 0.5.
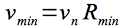 (Eq. 19)
Maximum Gas Velocity for Rmax Less than 1.5.
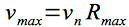 (Eq. 20)
Maximum Gas Velocity for Rmax Greater than or Equal to 1.5.
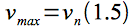 (Eq. 21)
Minimum Velocity Pressure.
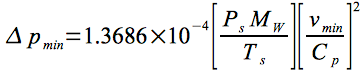 (Eq. 22)
Maximum Velocity Pressure.
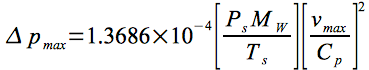 (Eq. 23)
Sampling Dwell Time at Each Point.
Ntp is the total number of traverse points. You must use the preliminary velocity traverse data.
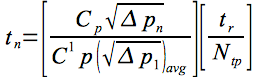 (Eq. 24)
Adjusted Velocity Pressure.
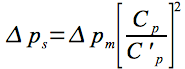 (Eq. 25)
Average Probe Blockage Factor.
 (Eq. 26)
Velocity Pressure.
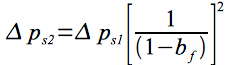 (Eq. 27)
Dry Gas Volume Sampled at Standard Conditions.
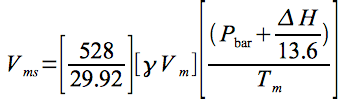 (Eq. 28)
Sample Flow Rate at Standard Conditions.
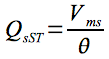 (Eq. 29)
Volume of Water Vapor.
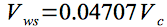 (Eq. 30)
Moisture Content of Gas Stream.
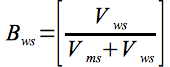 (Eq. 31)
Sampling Rate.
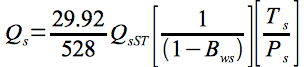 (Eq. 32)
(Note: The viscosity and Reynolds Number must be recalculated using the actual stack temperature, moisture, and oxygen content.)
Actual Particle Cut Diameter for Cyclone I.
This is based on actual temperatures and pressures measured during the test run.
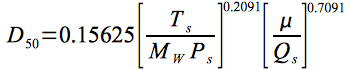 (Eq. 33)
Particle Cut Diameter for Nre Less than 3,162 for Cyclone IV.
C must be recalculated using the actual test run data and a D50 for 2.5 micrometer diameter particle size.
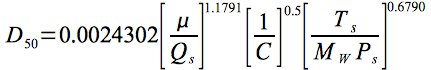 (Eq. 34)
Particle Cut Diameter for Nre Greater than or Equal to 3,162 for Cyclone IV.
C must be recalculated using the actual test run data and a D50 for 2.5 micrometer diameter particle size.
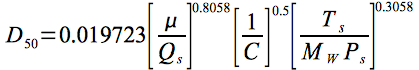 (Eq. 35)
Re-estimated Cunningham Correction Factor.
You must use the actual test run Reynolds Number (Nre) value and select the appropriate D50 from Equation 33 or 34 (or Equation 37 or 38 if reiterating).
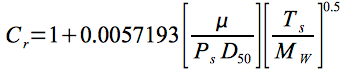 (Eq. 36)
Re-calculated Particle Cut Diameter for Nre Less than 3,162.
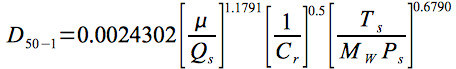 (Eq. 37)
Re-calculated Particle Cut Diameter for N Greater than or Equal to 3,162.
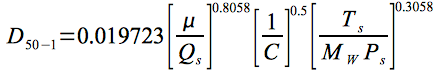 (Eq. 38)
Ratio (Z) Between D50 and D50-1 Values.
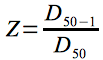 (Eq. 39)
Acceptance Criteria for Z Values.
The number of iterative steps is represented by N.
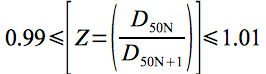 (Eq. 40)
Percent Isokinetic Sampling.
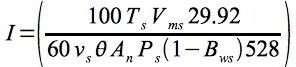 (Eq. 41)
Acetone Blank Concentration.
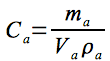 (Eq. 42)
Acetone Blank Correction Weight.
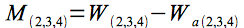 (Eq. 43)
Acetone Blank Weight.
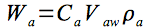 (Eq. 44)
Concentration of Total Filterable PM.
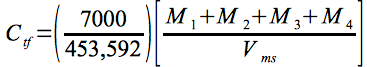 (Eq. 45)
Concentration of Filterable PM10.
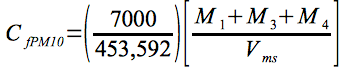 (Eq. 46)
Concentration of Filterable PM2.5.
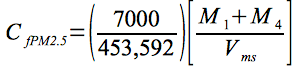 (Eq. 47)
13.0 Method Performance
13.1 Field evaluation of PM10 and total PM showed that the precision of constant sampling rate method was the same magnitude as Method 17 of appendix A-6 to part 60 (approximately five percent). Precision in PM10 and total PM between multiple trains showed standard deviations of four to five percent and total mass compared to 4.7 percent observed for Method 17 in simultaneous test runs at a Portland cement clinker cooler exhaust. The accuracy of the constant sampling rate PM10 method for total mass, referenced to Method 17, was -2 ± 4.4 percent (Farthing, 1988a).
13.2 Laboratory evaluation and guidance for PM10cyclones were designed to limit error due to spatial variations to 10 percent. The maximum allowable error due to an isokinetic sampling was limited to ± 20 percent for 10 micrometer particles in laboratory tests (Farthing, 1988b).
13.3 A field evaluation of the revised Method 201A by EPA showed that the detection limit was 2.54 mg for total filterable PM, 1.44 mg for filterable PM10, and 1.35 mg for PM2.5. The precision resulting from 10 quadruplicate tests (40 test runs) conducted for the field evaluation was 6.7 percent relative standard deviation. The field evaluation also showed that the blank expected from Method 201A was less than 0.9 mg (EPA, 2010).
14.0 Alternative Procedure
Alternative methods for estimating the moisture content (ALT-008) and thermocouple calibration (ALT-011) can be found at https://www.epa.gov/ttn/emc/approalt.html.
15.0 Waste Management [Reserved]
16.0 References
(1) Dawes, S.S., and W.E. Farthing. 1990. "Application Guide for Measurement of PM2.5 at Stationary Sources," U.S. Environmental Protection Agency, Atmospheric Research and Exposure Assessment Laboratory, Research Triangle Park, NC, 27511, EPA-600/3-90/057 (NTIS No.: PB 90-247198).
(2) Farthing, et al. 1988a. “PM10 Source Measurement Methodology: Field Studies,” EPA 600/3-88/055, NTIS PB89-194278/AS, U.S. Environmental Protection Agency, Research Triangle Park, NC 27711.
(3) Farthing, W.E., and S.S. Dawes. 1988b. “Application Guide for Source PM10 Measurement with Constant Sampling Rate,” EPA/600/3-88-057, U.S. Environmental Protection Agency, Research Triangle Park, NC 27711.
(4) Richards, J.R. 1996. "Test protocol: PCA PM10/PM2.5 Emission Factor Chemical Characterization Testing," PCA R&D Serial No. 2081, Portland Cement Association.
(5) U.S. Environmental Protection Agency, Federal Reference Methods 1 through 5 and Method 17, 40 CFR part 60, Appendix A-1 through A-3 and A-6.
(6) U.S. Environmental Protection Agency. 2010. “Field Evaluation of an Improved Method for Sampling and Analysis of Filterable and Condensable Particulate Matter.” Office of Air Quality Planning and Standards, Sector Policy and Program Division Monitoring Policy Group. Research Triangle Park, NC 27711.
17.0 Tables, Diagrams, Flowcharts, and Validation Data
You must use the following tables, diagrams, flowcharts, and data to complete this test method successfully.
Table 1. Typical PM Concentrations
| Particle Size Range | Concentration and % by Weight |
| Total collectable particulate | 0.015 gr/DSCF |
| Less than or equal to 10 and greater than 2.5 micrometers | 40% of total collectable PM |
| ≤ 2.5 micrometers | 20% of total collectable PM |
Table 2. Required Cyclone Cut Diameters (D50)
| Cyclone | Min. cut Diameter (Micrometer) | Max. Cut Diameter (Micrometer) |
| PM10 Cyclone (Cyclone I from five stage cyclone) | 9 | 11 |
| PM2.5 Cyclone (Cyclone IV from five stage cyclone) | 2.25 | 2.75 |
Table 3. Test Calculations
| If you are using... | To calculate... | Then use... |
| Preliminary data | Dry gas molecular weight, Md | Equation 1 |
| Dry gas molecular weight (Md) and preliminary moisture content of the gas stream | wet gas molecular weight, MW | Equation 2a |
| Stack gas temperature, and oxygen and moisture content of the gas stream | gas viscosity, μ | Equation 3 |
| Gas viscosity, μ | Cunningham correction factorb, C | Equation 4 |
| Reynolds Numberc (Nre), Nre less than 3,162 | Preliminary lower limit cut diameter for cyclone I, D50LL | Equation 5 |
| D50LL from Equation 5 | Cut diameter for cyclone I for middle of the overlap zone, D50T | Equation 6 |
| D50T from Equation 6 | Final sampling rate for cyclone I, QI (Qs) | Equation 7 |
| D50 for PM2.5cyclone and Nre less than 3,162 | Final sampling rate for cyclone IV, QIV | Equation 8 |
| D50 for PM2.5cyclone and Nre greater than or equal to 3,162 | Final sampling rate for cyclone IV, QIV | Equation 9 |
| QI(Qs) from Equation 7 | Verify the assumed Reynolds number, Nre | Equation 10 |
a Use Method 4 to determine the moisture content of the stack gas. Use a wet bulb-dry bulb measurement device or hand-held hygrometer to estimate moisture content of sources with gas temperature less than 160°F.
b For the lower cut diameter of cyclone IV, 2.25 micrometer.
c Verify the assumed Reynolds number, using the procedure in Section 8.5.1, before proceeding to Equation 11.
Table 4. ΔH Values Based on Preliminary Traverse Data
| Stack Temperature (°R) | Ts- 50° | Ts | Ts + 50° |
| ΔH, (inches W.C.) | a | a | a |
a These values are to be filled in by the stack tester.
Table 5. Verification of the Assumed Reynolds Number
| If the Nre is ... | Then ... | And ... |
| Less than 3,162 | Calculate ΔH for the meter box | Assume original D50LLis correct |
| Greater than or equal to 3,162 | Recalculate D50LLusing Equation 12 | Substitute the “new” D50LL into Equation 6 to recalculate D50T |
Table 6. Calculations for Recovery of PM10 and PM2.5
| Calculations | Instructions and References |
| Average dry gas meter temperature | See field test data sheet. |
| Average orifice pressure drop | See field test data sheet. |
| Dry gas volume (Vms) | Use Equation 28 to correct the sample volume measured by the dry gas meter to standard conditions (20°C, 760 mm Hg or 68°F, 29.92 inches Hg). |
| Dry gas sampling rate (QsST) | Must be calculated using Equation 29. |
| Volume of water condensed (Vws) | Use Equation 30 to determine the water condensed in the impingers and silica gel combination. Determine the total moisture catch by measuring the change in volume or weight in the impingers and weighing the silica gel. |
| Moisture content of gas stream (Bws) | Calculate this using Equation 31. |
| Sampling rate (Qs) | Calculate this using Equation 32. |
| Test condition Reynolds numbera | Use Equation 10 to calculate the actual Reynolds number during test conditions. |
| Actual D50 of cyclone I | Calculate this using Equation 33. This calculation is based on the average temperatures and pressures measured during the test run. |
| Stack gas velocity (vs) | Calculate this using Equation 13. |
| Percent isokinetic rate (%I) | Calculate this using Equation 41. |
a Calculate the Reynolds number at the cyclone IV inlet during the test based on: (1) the sampling rate for the combined cyclone head, (2) the actual gas viscosity for the test, and (3) the dry and wet gas stream molecular weights.
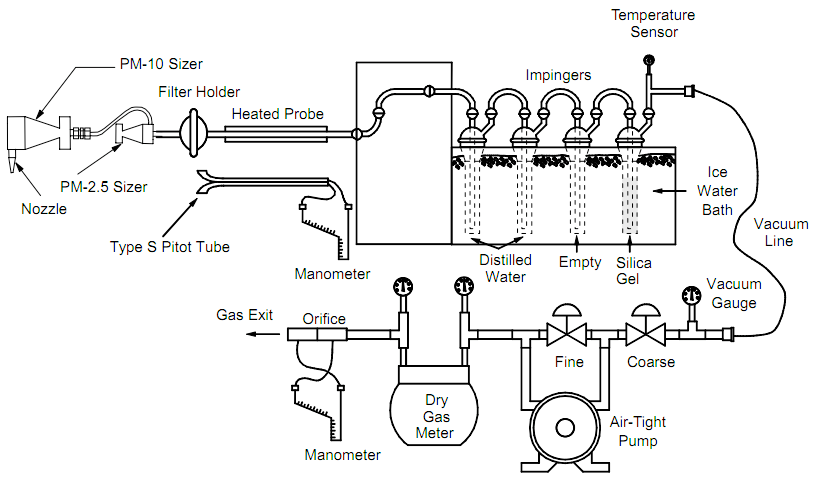
Figure 1. In-stack PM10 and PM2.5 Sampling Train
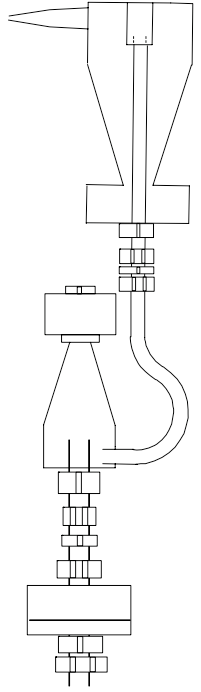
Figure 2. Combined Cyclone Sampling Head
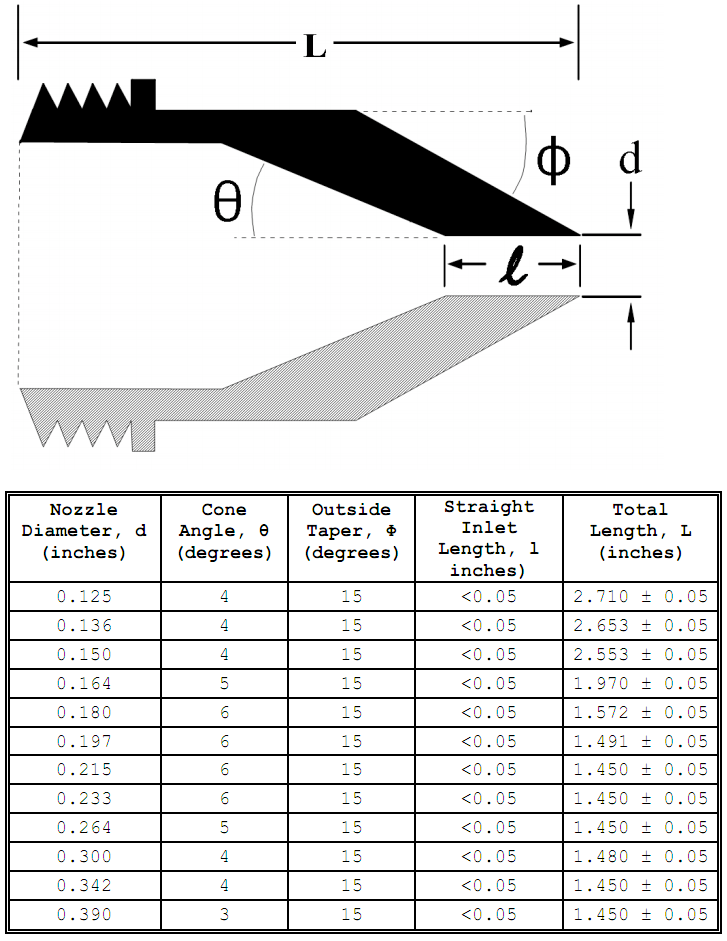
Figure 3. Nozzle Design Specifications for PM10 Cyclone
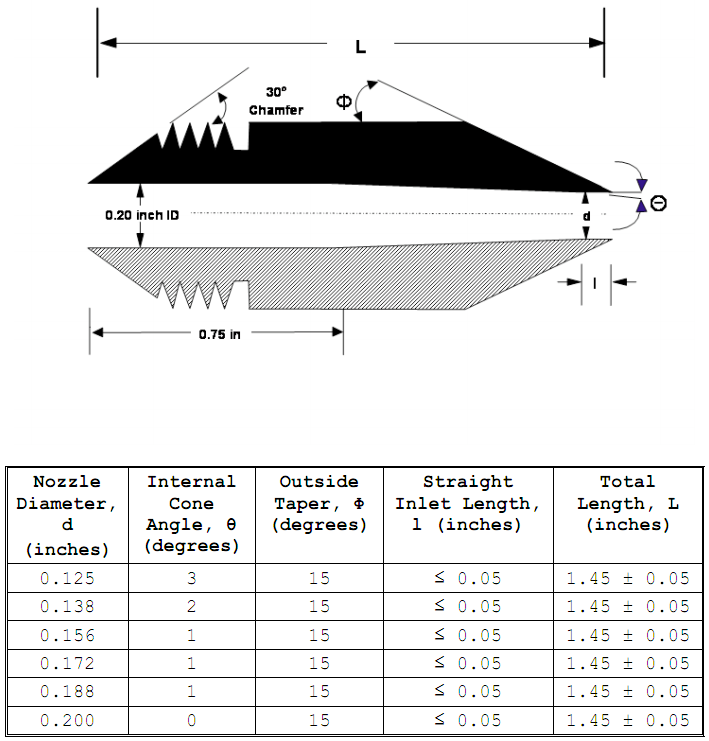
Figure 4A. Nozzle Design for PM2.5 Cyclone (Higher Stack Flow)
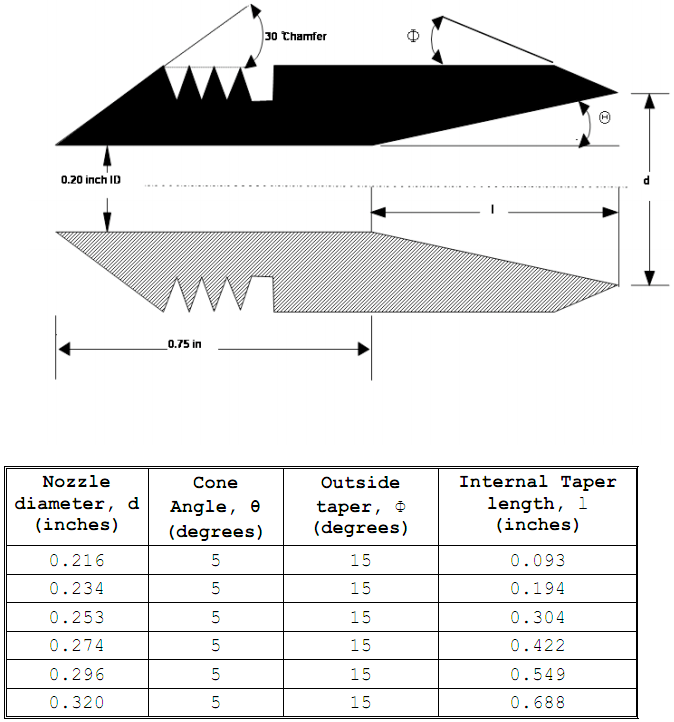
Figure 4B. Nozzle Design for PM2.5 Cyclone (Lower Stack Flow
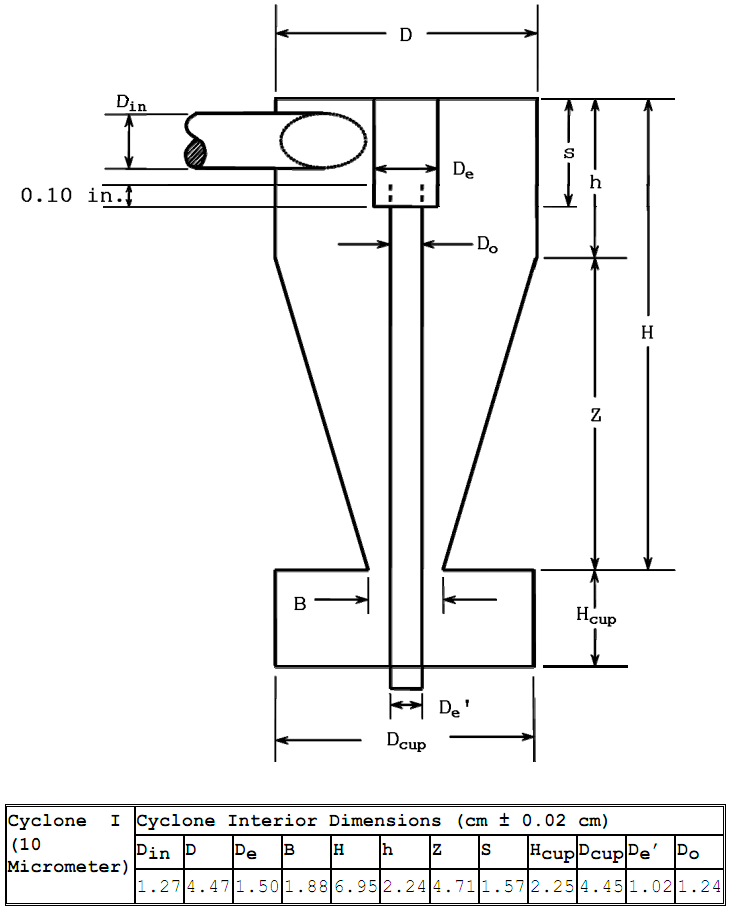
Figure 5. Design Specifications for Cyclone I (10 Micrometer)
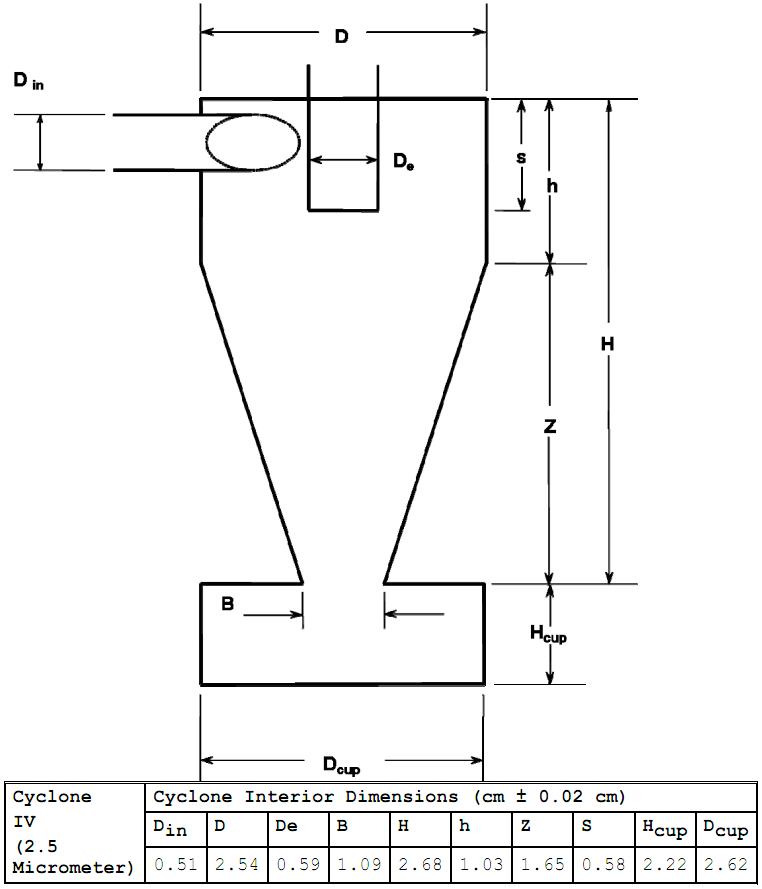
Figure 6. Design Specifications for Cyclone IV (2.5 Micrometer) Sizing Device
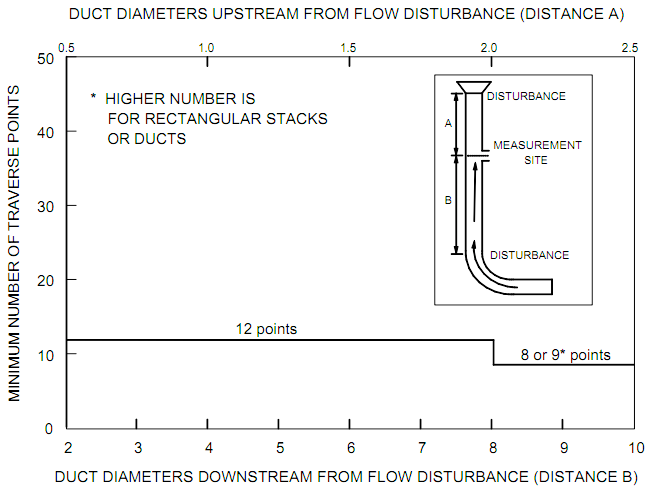
Figure 7. Minimum Number of Traverse Points for Preliminary Method 4 Traverse
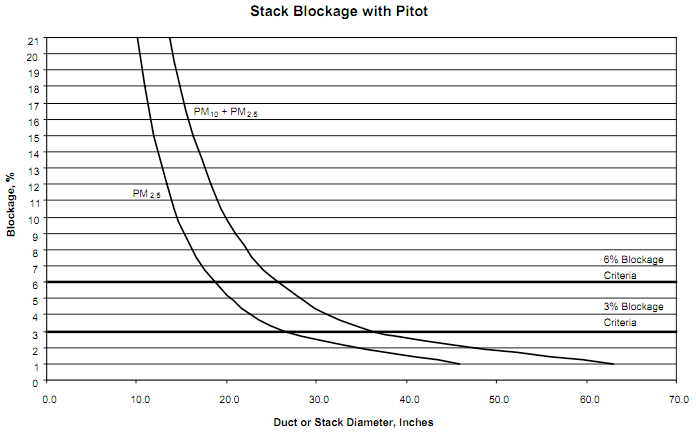
Figure 8. Gas Flow Blockage by the Sampling Heads with the Pitot Tube
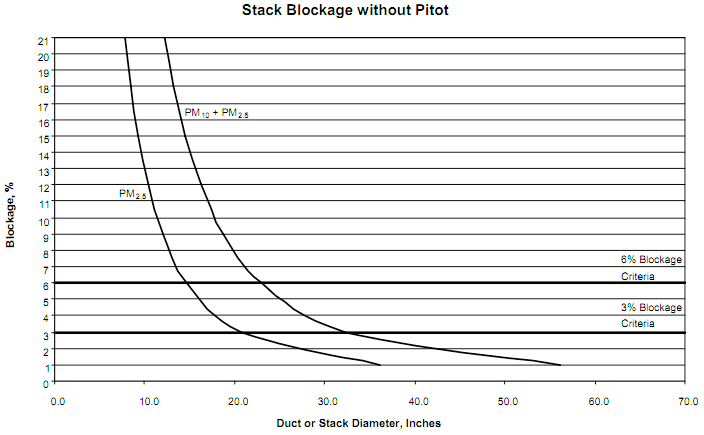
Figure 9. Gas Flow Blockage by the Sampling Heads without the Pitot Tube
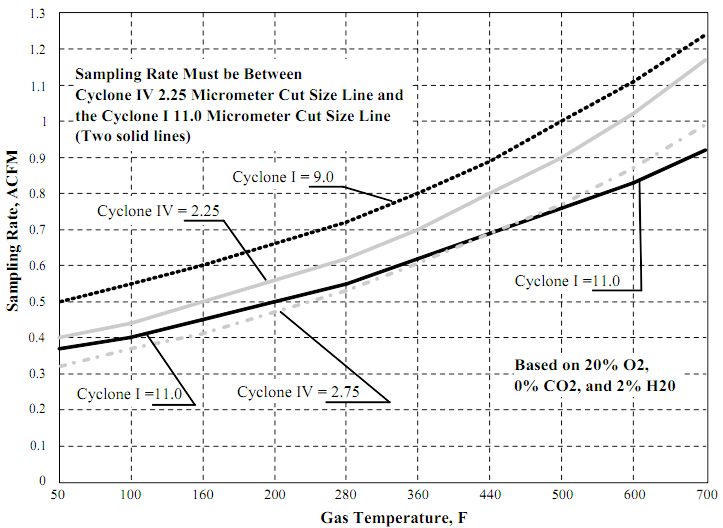
Figure 10. Acceptable Sampling Rate for Combined Cyclone Heads
RELATED LINKS
USA EPA Webpage for EPA Method 201a
Comparison of This Page with EPA Method 201a online.
- Analytical
- Ion Chromatography
- Gas Chromatography
- Gravimetrics
- Ash Resistivity
- Inks/Coatings
- Scrubber Stoichiometry
- Titrations
- Mercury Sorbent Trap
- Engineering
- Express Products
- Rental Instruments
- MET80 Mercury Monitor
- Continuous Emission Monitors
- Gas Sampling Equipment
- Mobile Power Supply
Our Resources
- Technical Resources